 Catalogue PIGMA
Helpdesk CERSAT
Type of resources
Topics
Keywords
Contact for the resource
Provided by
Years
Formats
Representation types
status
Scale
Resolution
-
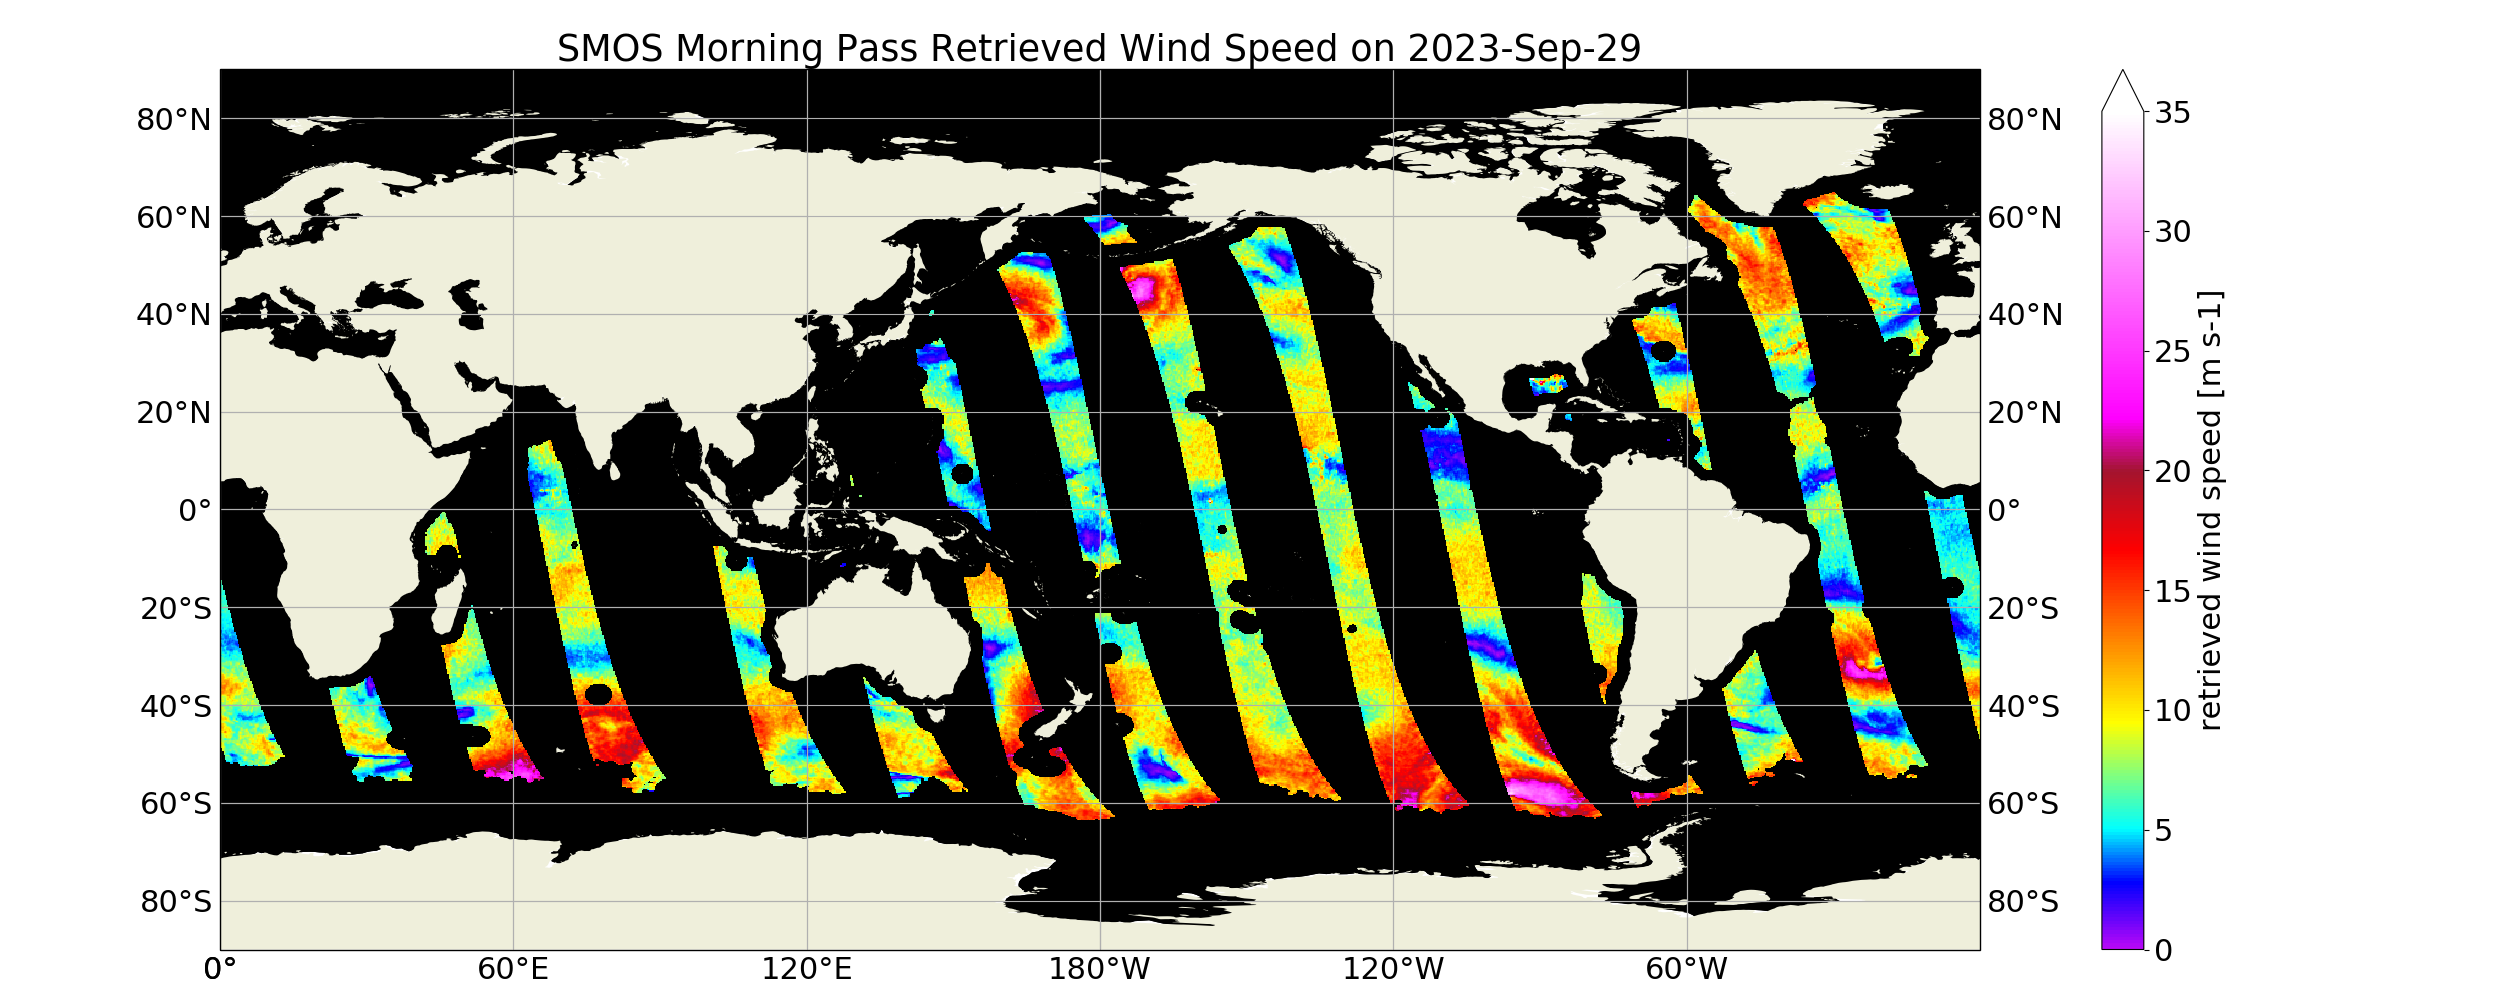
“SMOS Level 3 daily wind speed” (SMOS L3WS) products are daily composite maps of the collected SMOS L2 swath wind products for a specific day, provided with the same grid than the Level 2 wind data (SMOS L2WS NRT) but separated into ascending and descending passes. SMOS L3WS products are available the day after from sensing and are generated in NetCDF-4 format as described in the "SMOS Wind Data Service Product Description Document" (http://www.smosstorm.org/Document-tools/SMOS-Wind-Data-Service-Documentation ).
-
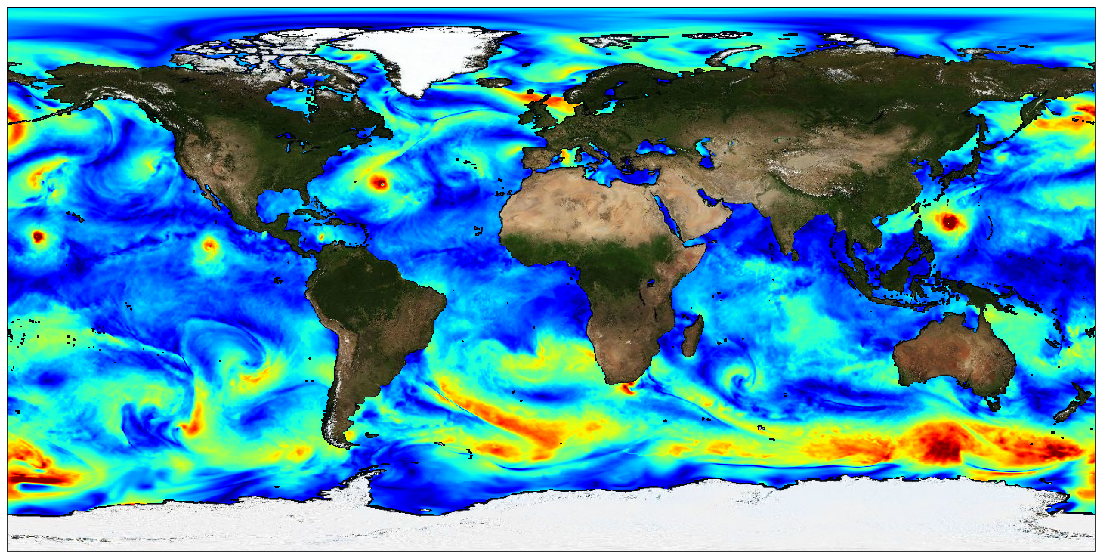
A prerequisite for a successful development of a multi-mission wind dataset is to ensure good inter-calibration of the different extreme wind datasets to be integrated in the product. Since the operational hurricane community is working with the in-situ dropsondes as wind speed reference, which are in turn used to calibrate the NOAA Hurricane Hunter Stepped Frequency Microwave Radiometer (SFMR) wind data, MAXSS has used the latter to ensure extreme-wind inter-calibration among the following scatterometer and radiometer systems: the Advanced Scatterometers onboard the Metop series (i.e., ASCAT-A, -B, and -C), the scatterometers onboard Oceansat-2 (OSCAT) and ScatSat-1 (OSCAT-2), and onboard the HY-2 series (HSCAT-A, -B); the Advanced Microwave Scanning Radiometer 2 onboard GCOM-W1(AMSR-2), the multi-frequency polarimetric radiometer (Windsat), and the L-band radiometers onboard the Soil Moisture and Ocean Salinity (SMOS) and the Soil Moisture Active Passive (SMAP) missions. In summary, a two-step strategy has been followed to adjust the high and extreme wind speeds derived from the mentioned scatterometer and radiometer systems, available in the period 2009-2020. First, the C-band ASCATs have been adjusted against collocated storm-motion centric SFMR wind data. Then, both SFMR winds and ASCAT adjusted winds have been used to adjust all the other satellite wind systems. In doing so, a good inter-calibration between all the systems is ensured not only under tropical cyclone (TC) conditions, but also elsewhere. This dataset was produced in the frame of the ESA funded Marine Atmosphere eXtreme Satellite Synergy (MAXSS) project. The primary objective of the ESA Marine Atmosphere eXtreme Satellite Synergy (MAXSS) project is to provide guidance and innovative methodologies to maximize the synergetic use of available Earth Observation data (satellite, in situ) to improve understanding about the multi-scale dynamical characteristics of extreme air-sea interaction.
-
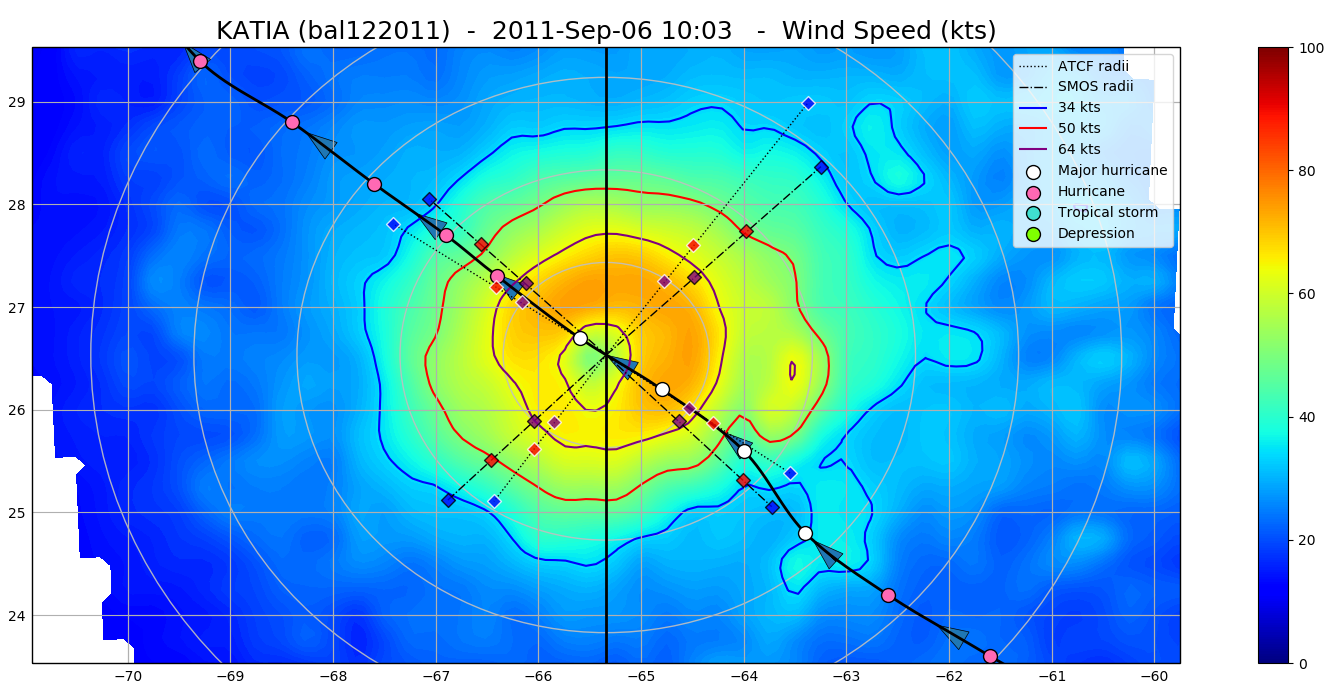
The SMOS WRF product is available in Near Real Time to support tropical cyclones (TC) forecasts. It is generated within 4 to 6 hours from sensing from the SMOS L2 swath wind speed products (SMOS L2WS NRT), in the so-called "Fix (F-deck)" format compatible with the US Navy's ATCF (Automated Tropical Cyclone Forecasting) System. The SMOS WRF "fixes" to the best-track forecasts contain : the SMOS 10-min maximum-sustained winds (in knots) and wind radii (in nautical miles) for the 34 kt (17 m/s), 50 kt (25 m/s) and 64 kt (33 m/s) winds per geographical storm quadrants, and for each SMOS pass intercepting a TC in all the active ocean basins. See the complete description the "SMOS Wind Data Service Product Description Document" ( http://www.smosstorm.org/Document-tools/SMOS-Wind-Data-Service-Documentation ).
-
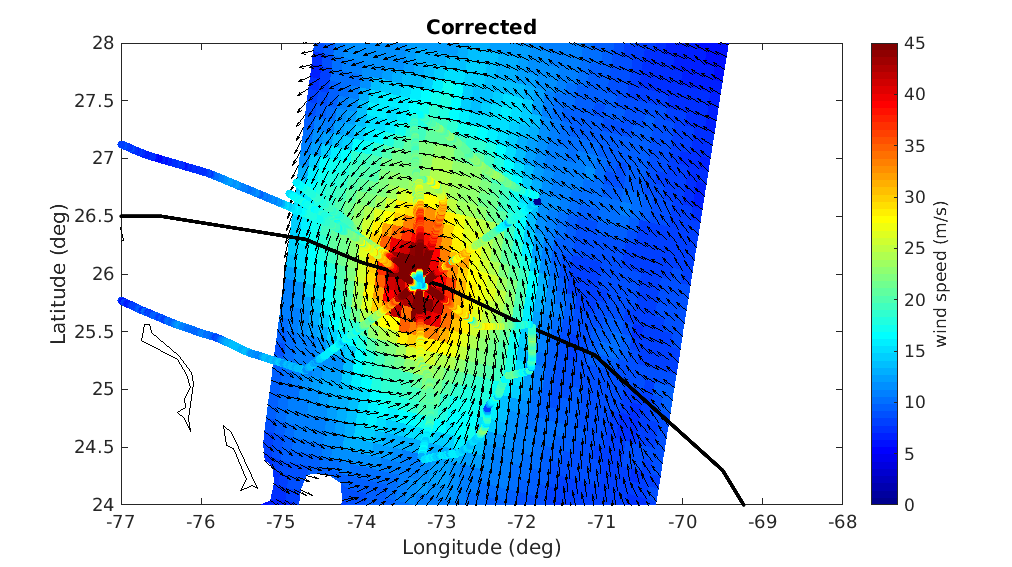
The Level 4 merged microwave wind product is a complete set of hourly global 10-m wind maps on a 0.25x0.25 degree latitude-longitude grid, spanning 1 Jan 2010 through the end of 2020. The product combines background neutral equivalent wind fields from ERA5, daily surface current fields from CMEMS, and stress equivalent winds obtained from several microwave passive and active sensors to produce hourly surface current relative stress equivalent wind analyses. The satellite winds include those from recently launched L-band passive sensors capable of measuring extreme winds in tropical cyclones, with little or no degradation from precipitation. All satellite winds used in the analyses have been recalibrated using a large set of collocated satellite-SFMR wind data in storm-centric coordinates. To maximize the use of the satellite microwave data, winds within a 24-hour window centered on the analysis time have been incorporated into each analysis. To accomodate the large time window, satellite wind speeds are transformed into deviations from ERA5 background wind speeds interpolated to the measurement times, and then an optical flow-based morphing technique is applied to these wind speed increments to propagate them from measurement to analysis time. These morphed wind speed increments are then added to the background wind speed at the analysis time to yield a set of total wind speeds fields for each sensor at the analysis time. These individual sensor wind speed fields are then combined with the background 10-m wind direction to yield vorticity and divergence fields for the individual sensor winds. From these, merged vorticity and divergence fields are computed as a weighted average of the individual vorticity and divergence fields. The final vector wind field is then obtained directly from these merged vorticity and divergence fields. Note that one consequence of producing the analyses in terms of vorticity and divergence is that there are no discontinuities in the wind speed fields at the (morphed) swath edges. There are two important points to be noted: the background ERA5 wind speed fields have been rescaled to be globally consistent with the recalibrated AMSR2 wind speeds. This rescaling involves a large increase in the ERA5 background winds beyond about 17 m/s. For example, an ERA5 10 m wind speed of 30 m/s is transformed into a wind speed of 41 m/s, and a wind speed of 34 m/s is transformed into a wind speed of about 48 m/s. Besides the current version of the product is calibrated for use within tropical cyclones and is not appropriate for use elsewhere. This dataset was produced in the frame of ESA MAXSS project. The primary objective of the ESA Marine Atmosphere eXtreme Satellite Synergy (MAXSS) project is to provide guidance and innovative methodologies to maximize the synergetic use of available Earth Observation data (satellite, in situ) to improve understanding about the multi-scale dynamical characteristics of extreme air-sea interaction.
-
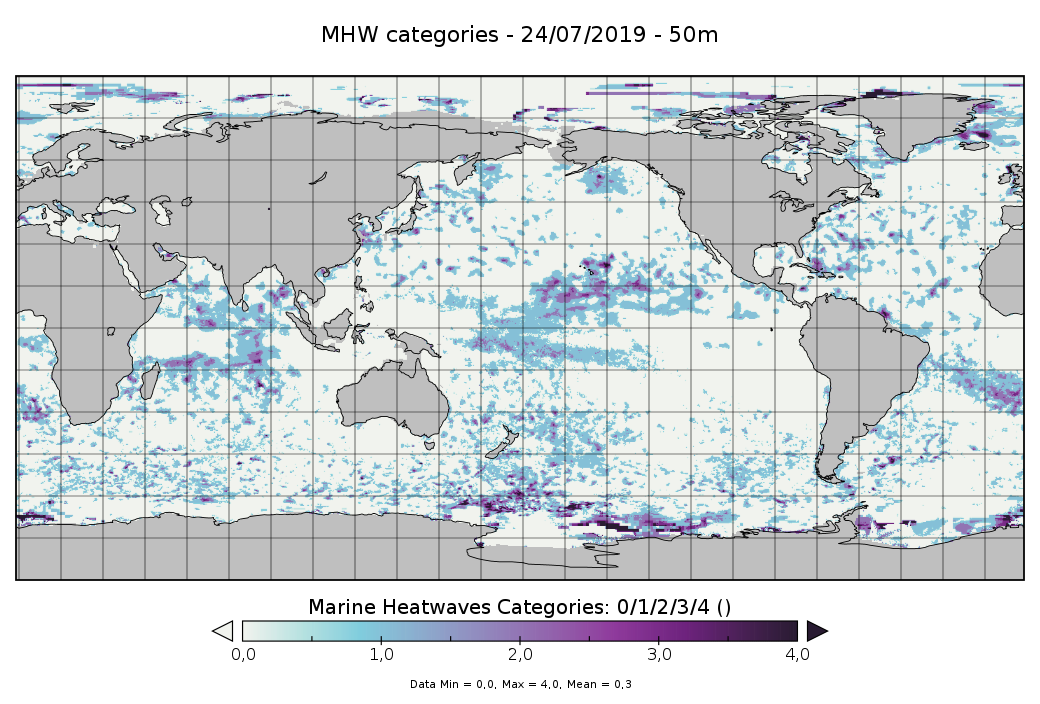
These datasets contain 4D (x, y, z, t) weekly temperature and marine heatwaves (MHW) categories estimated from the surface up to 300-m depth, at a 0.25°x0.25° horizontal grid resolution and for 4 areas of interest that are: • Area 1 (around the Madeira Islands): 30°N-35°N, 15°W-20°W • Area 2 (Tropical Pacific Ocean): 30°S-30°N, 120°E-130°W • Area 3 (Mediterranean Sea): 40°N-45°N, 15°W-20°W • Area 4 (Global): 82.875°S-89.875°N, 0.125°E-359.875°E The weekly MHW are centered on the date of the file (±3days). For the temperature reconstruction, 2 approaches have been used: - for the regional areas, the temperature has been computed with a 2 steps method: a first estimate of the vertical temperature profiles by using a machine learning approach (Multi-Layer Perceptron (MLP)) and then, a combination of this field with in situ temperature profiles observations through an optimal interpolation algorithm. The Copernicus Marine Service ARMOR3D dataset was used as the targeted temperature field for the MLP. The input data used are: • First step: ◦ SST data are from daily OSTIA analyses [from Copernicus Marine Service: SST_GLO_SST_L4_REP_OBSERVATIONS_010_011 product] interpolated over the 0.25°x0.25° targeted grid resolution; ◦ SLA data are from the Copernicus Marine Service product SEALEVEL_GLO_PHY_L4_REP_OBSERVATIONS_008_047/dataset-duacs-rep-global-merged-allsat-phy-l4 • Second step: ◦ The in situ data are from the Copernicus Marine Service In Situ TAC and contains several observations type: CTD, Argo floats, drifting buoys, moorings, marine mammals). - For the global area, the temperature comes from the Copernicus Marine Service product ARMOR3D (MULTIOBS_GLO_PHY_TSUV_3D_MYNRT_015_012 (https://doi.org/10.48670/moi-00052). The MHW categories are derived from the Hobday’s method [Hobday et al.,2018] for the 4 areas. Each MHW event is classified among four categories (moderate to extreme), identified in terms of multiples of the local difference between the 90th percentile and climatological values, and defined as moderate (1-2×, Category I), strong (2-3×, Category II), severe (3-4×, Category III), and extreme (>4×, Category IV). When the category is zero, this means that there is no MHW. The period 1993-2021 is used as a baseline for defining the climatology to be as close as possible to the 30-year period suggested by Hobday. This choice is motivated by the need of altimetry data to constrain the vertical temperature reconstruction, which is required for most ocean reanalyses as well, therefore the baseline period slightly differs from the one used for the 2D atlas.
-
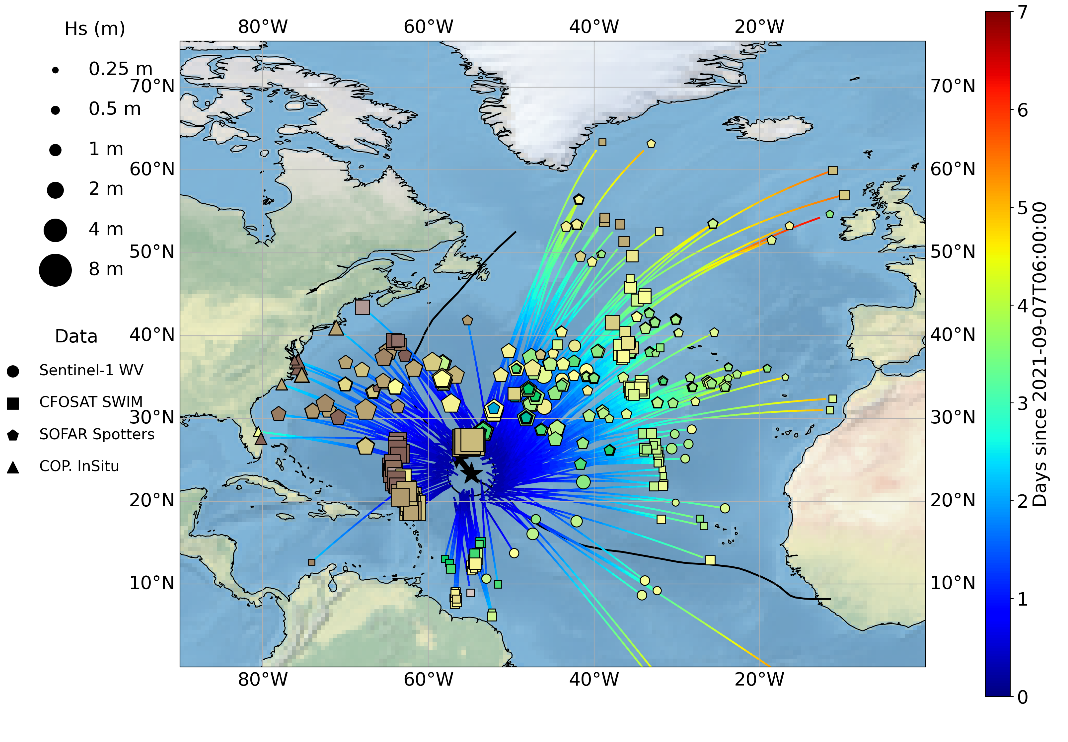
The main objectives of this dataset is to gather the ocean swells measured by different sensors, including satellite and in-situ sources, that were generated by a given tropical cyclone (TC). This dataset aims at providing characteristics of these swells such as their direction, wavelength (or period) and energy but also the date when they left the influence of the tropical cyclone wind to propagate freely. Wave spectra in tropical cyclones vary strongly per quadrant and provide information about the current and past state of the wave field. However, inside TCs, waves measurements including the wave system direction, energy and wavelength are rare and difficult to obtain with in-situ and remote sensing technics. For this dataset, both moored and drifting buoys are considered as long as they provide wave systems measurements. For the satellite contribution, Synthetic Aperture Radar (SAR) and real aperture radar (RAR) instruments can significantly contribute to the TC-generated waves documentation. Indeed, ocean wave spectra can be derived from modulations of the backscatter in SAR and RAR signal. SAR on board European satellite and in particular the SAR series developed since ERS-1 by ESA and now ESA/Copernicus with Sentinel-1 mission (S-1) are good candidates to provide these ocean waves systems characteristics thanks to the dedicated acquisition mode : the so-called Wave Mode. The wave spectrometer SWIM developed by the French space Agency (CNES) and embedded on the Chinese-French Oceanography SATellite (CFOSAT) has been launched more recently with a new measurement concept relying on a RAR and can certainly complement the S-1 data collection. Although the reasons are different, these two systems are limited for measuring waves generation area within the TC vortex where strong rain rates and wind regimes are observed. Far enough from their source, satellite acquisitions are thus expected to be able to observe these ocean swells during more favorable met-ocean conditions for waves retrieval inversion. As a consequence, our analysis is focused on waves originating from TC but that have been able to propagate far from their source. The analysis of swell measurements far from their area of generation to locate the storm source has been firstly applied to data from one single in-situ wave station (wave energy with frequency and direction) collected 2 miles off shore from San Clemente Island, California and extended to a network of several wave stations in the sixties. More recently, the gathering of swell system observed with SAR far from a storm to characterize the waves properties across the ocean has proven to be efficient in the case of extra-tropical storms. Yet, such analysis is not adapted to Tropical Cyclone whose size is much smaller and currently existing wave datasets do not allow for an accurate monitoring of the tropical cyclones swells. This multi-sensor Level-3 tropical cyclone waves dataset intends to fill this gap and opens for an alternate way of estimating tropical cyclone waves properties over all ocean basins and for all tropical cyclones. This dataset was produced in the frame of the ESA funded Marine Atmosphere eXtreme Satellite Synergy (MAXSS) project. The primary objective of the ESA Marine Atmosphere eXtreme Satellite Synergy (MAXSS) project is to provide guidance and innovative methodologies to maximize the synergetic use of available Earth Observation data (satellite, in situ) to improve understanding about the multi-scale dynamical characteristics of extreme air-sea interaction.
-
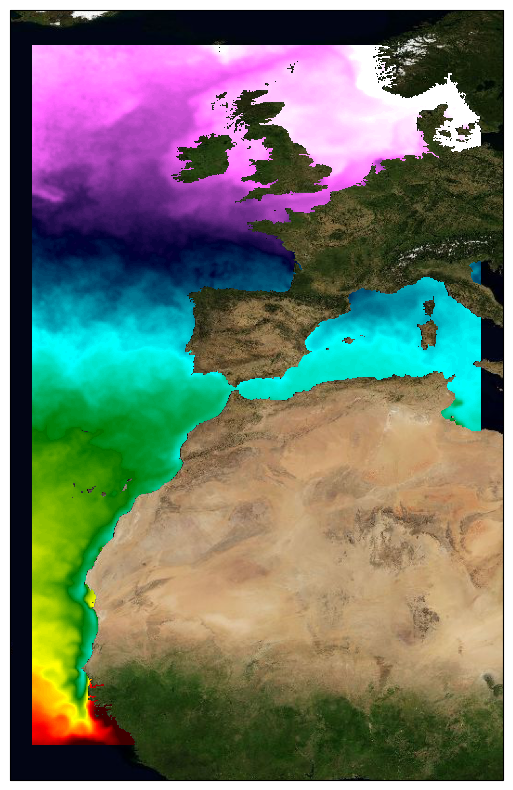
This dataset provide a times series of daily multi-sensor composite fields of Sea Surface Temperature (SST) foundation at ultra-high resolution (HR) on a 0.02 x 0.02 degree grid (approximately 2 x 2 km) for the North East Atlantic, every 24 hours. An Optimal interpolation (OI) technique is used to combine coincident swath measures of SST from different types satellite sensors and to fill gaps where no observations are available or obstructed by clouds. This multi-sensor compositing and interpolation process categorizes this dataset as a Level 4 product. Each daily mean field is available the next day before 12:00. Whereas along swath observation data essentially represent the skin or sub-skin SST, the L3S SST product is defined to represent the SST foundation (SSTfnd). SSTfnd is defined within GHRSST as the temperature at the base of the diurnal thermocline. It is so named because it represents the foundation temperature on which the diurnal thermocline develops during the day. SSTfnd changes only gradually along with the upper layer of the ocean, and by definition it is independent of skin SST fluctuations due to wind- and radiation-dependent diurnal stratification or skin layer response. It is therefore updated at intervals of 24 hrs. SSTfnd corresponds to the temperature of the upper mixed layer which is the part of the ocean represented by the top-most layer of grid cells in most numerical ocean models. It is never observed directly by satellites, but it comes closest to being detected by infrared and microwave radiometers during the night, when the previous day's diurnal stratification can be assumed to have decayed. The processing combines the observations of multiple polar orbiting and geostationary satellites, embedding infrared of microwave radiometers. All these sources are intercalibrated with eachother before merging. This dataset is generated daily within a 24 delay and is therefore suitable for assimilation into operational models. It is produced in the frame of Copernicus Marine Service and the data available through various tools and protocols with a simple user registration from this service (product identifier: SST_ATL_SST_L4_NRT_OBSERVATIONS_010_025) at: https://data.marine.copernicus.eu/product/SST_ATL_SST_L4_NRT_OBSERVATIONS_010_025/
-
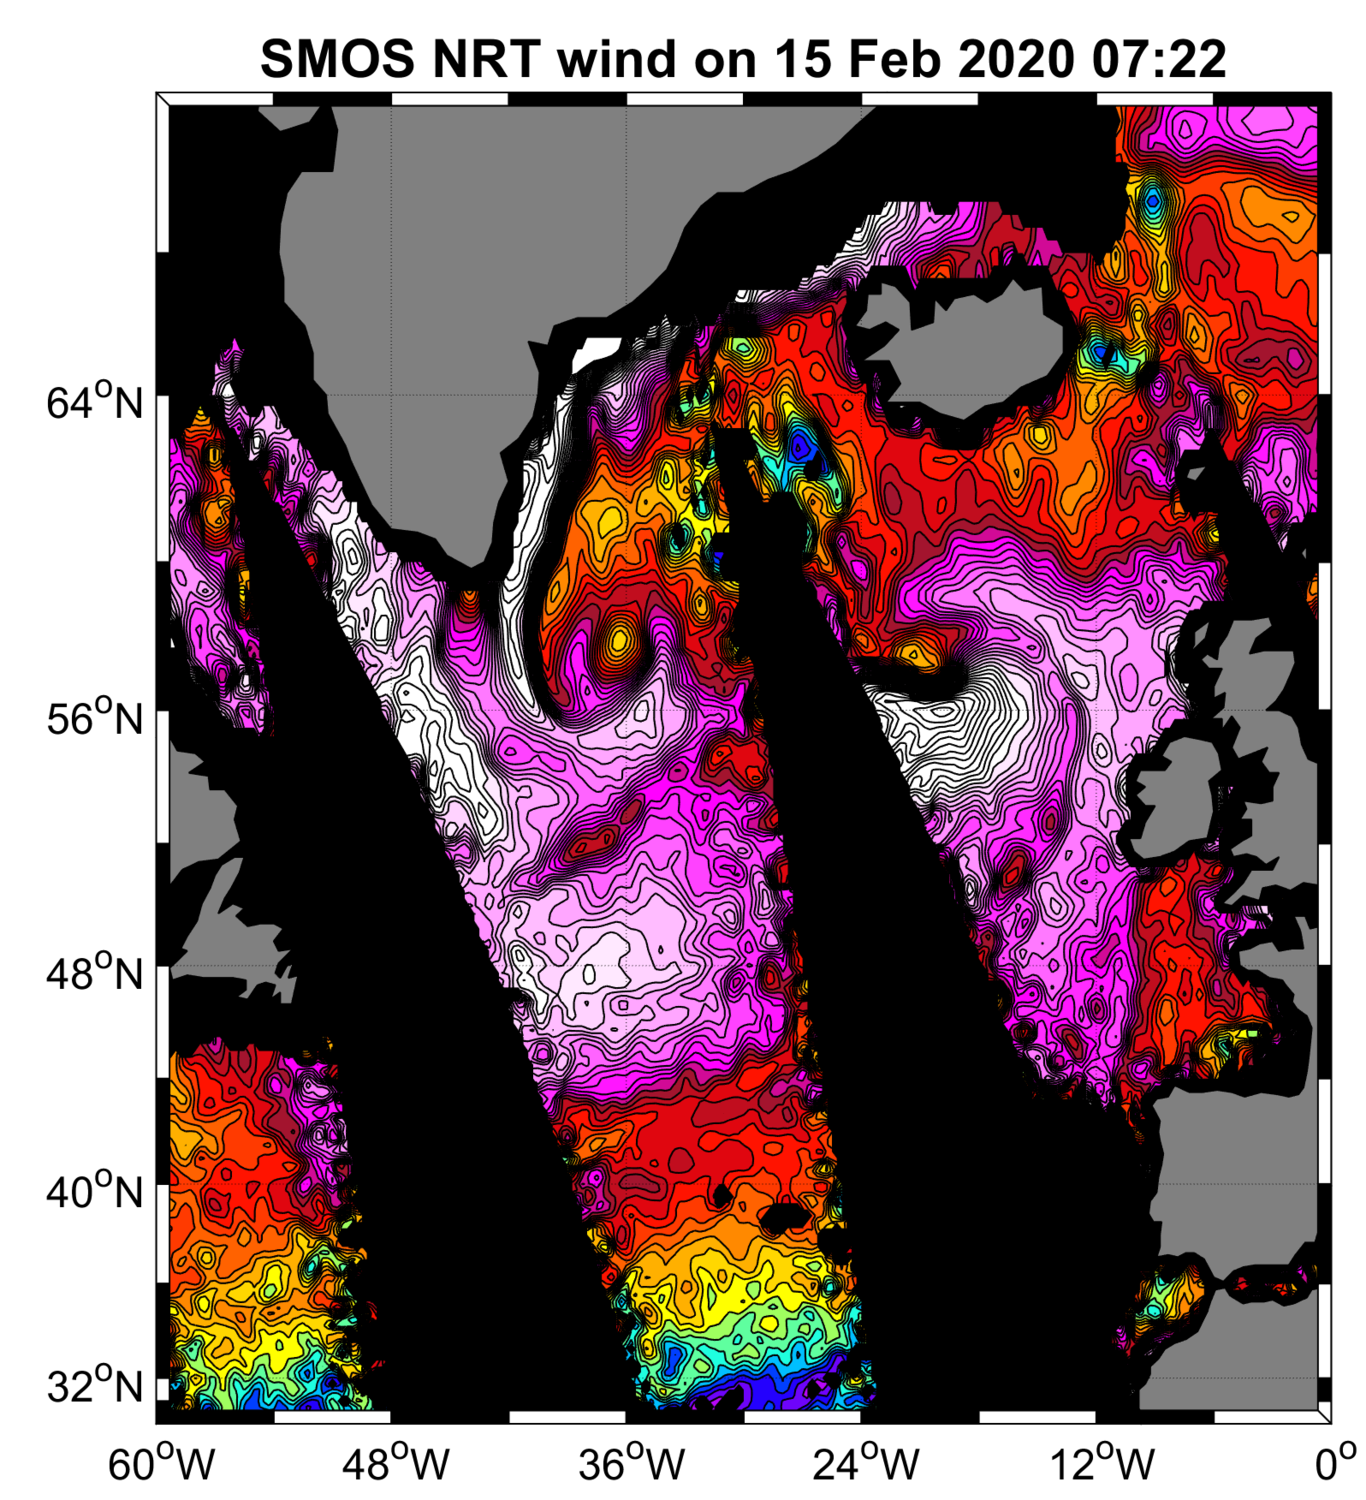
“SMOS Near Real Time Level 2 swath wind speed” (SMOS L2WS NRT) products, which are SMOS retrieved surface wind speed gridded maps with a spatial sampling of 1/4°x 1/4° and consisting of orbital segments (containing parts of ascending and descending half orbits) following the granularity of the SMOS Level 1B near real time (NRT) data products. SMOS L2WS NRT products are available within 4 to 6 hours from sensing and are generated in NetCDF-4 format as described in the "SMOS Wind Data Service Product Description Document" (http://www.smosstorm.org/Document-tools/SMOS-Wind-Data-Service-Documentation).
-
This dataset provide a times series of daily multi-sensor composite fields of Sea Surface Temperature (SST) foundation at ultra high resolution (UHR) on a 0.02 x 0.02 degree grid (approximately 2 x 2 km) for the North-East Atlantic (European North West shelf, Iberia, Bay of Biscay, Irish Sea down to Canary upwelling), every 24 hours. Whereas along swath observation data essentially represent the skin or sub-skin SST, the L3S SST product is defined to represent the SST foundation (SSTfnd). SSTfnd is defined within GHRSST as the temperature at the base of the diurnal thermocline. It is so named because it represents the foundation temperature on which the diurnal thermocline develops during the day. SSTfnd changes only gradually along with the upper layer of the ocean, and by definition it is independent of skin SST fluctuations due to wind- and radiation-dependent diurnal stratification or skin layer response. It is therefore updated at intervals of 24 hrs. SSTfnd corresponds to the temperature of the upper mixed layer which is the part of the ocean represented by the top-most layer of grid cells in most numerical ocean models. It is never observed directly by satellites, but it comes closest to being detected by infrared and microwave radiometers during the night, when the previous day's diurnal stratification can be assumed to have decayed. The processing combines the observations of multiple polar orbiting and geostationary satellites, embedding infrared of microwave radiometers. All these sources are intercalibrated with each other before merging. A ranking procedure is used to select the best sensor observation for each grid point. The processing is described on Copernicus Marine Service [SST_ATL_PHY_L3S_NRT_010_037 dataset] and users can refer to the user manual and quality documents available there for more details. This dataset is generated daily within a 24 delay and is therefore suitable for assimilation into operational models. It is produced in the frame of Copernicus Marine Service and the data available through various tools and protocols with a simple user registration from this service (product identifier: SST_ATL_PHY_L3S_NRT_010_037) at: https://data.marine.copernicus.eu/product/SST_ATL_PHY_L3S_NRT_010_037/
-
The main objective of the SWIM Level 3 (L3) product is to provide global gridded wave statistics from the along-track directional wave spectra measures, as observed with SWIM instrument onboard CFOSAT. CFOSAT (Chinese French Ocean SATellite) is a french-chinese mission launched in 2018, whose aim is to provide wind (SCAT instrument) and wave (SWIM instrument) measurements over the sea surface. The processing uses the integrated parameters (wave length, significant wave height, direction) of the wave systems associated with the individual partitions retrieved from SWIM wave spectra, computing monthly statistics such as distribution, min, max, mean and median over a global 2 degree resolution grid. Three sub-products are generated separately for each SWIM beam (from 4° to 10°) from respectively the SWIM Level 2 spectra produced by the CWWIC center (CNES), the SWIM Level 2S spectra produced by the IWWOC center (Ifremer) and forecast spectra produced from WaveWatch3 wave model at Ifremer as an independent source for comparison. The SWIM level 3 dataset is generated in delayed mode. It is currently mainly meant as a validation dataset aiming at inter-comparing the different SWIM Level 2 between each other, with an independent model (here WaveWatch3) or other external similar wave statistics products. The SWIM L3 dataset is generated and distributed by Ifremer / CERSAT in the frame of the Ifremer Wind and Wave Operation Center (IWWOC) co-funded by Ifremer and CNES and dedicated to the processing of the delayed mode data of CFOSAT mission.